How to use Firefox Developer Tools in 2026
Firefox includes a built-in toolkit for inspecting layouts, editing CSS, debugging JavaScript and testing responsive views. Here is how to use it in practice.

Mozilla’s Firefox Developer Tools ship with the browser already. No extension. No separate install. For Australian developers who reach for Chrome by habit, that is easy to miss. The upside is practical: a solid front-end debugging workflow, up and running inside 15 minutes, without adding another browser profile before the real work starts.
This guide covers six jobs that come up in day-to-day development: opening the panels, inspecting HTML and CSS, changing styles live, testing console output, stepping through scripts, and checking a document at mobile sizes. It sticks to Mozilla’s own docs and the Firefox Developer Edition overview so each step maps back to an official reference. No browser-war detour. Just the workflow.
Before anything else, load the page you want to debug in a current Firefox release or Firefox Developer Edition. Keep one simple test page open: a landing page, form or component demo with visible text, a button and at least one stylesheet. That makes before-and-after changes easier to see.
1. Open Firefox Developer Tools and choose one home panel
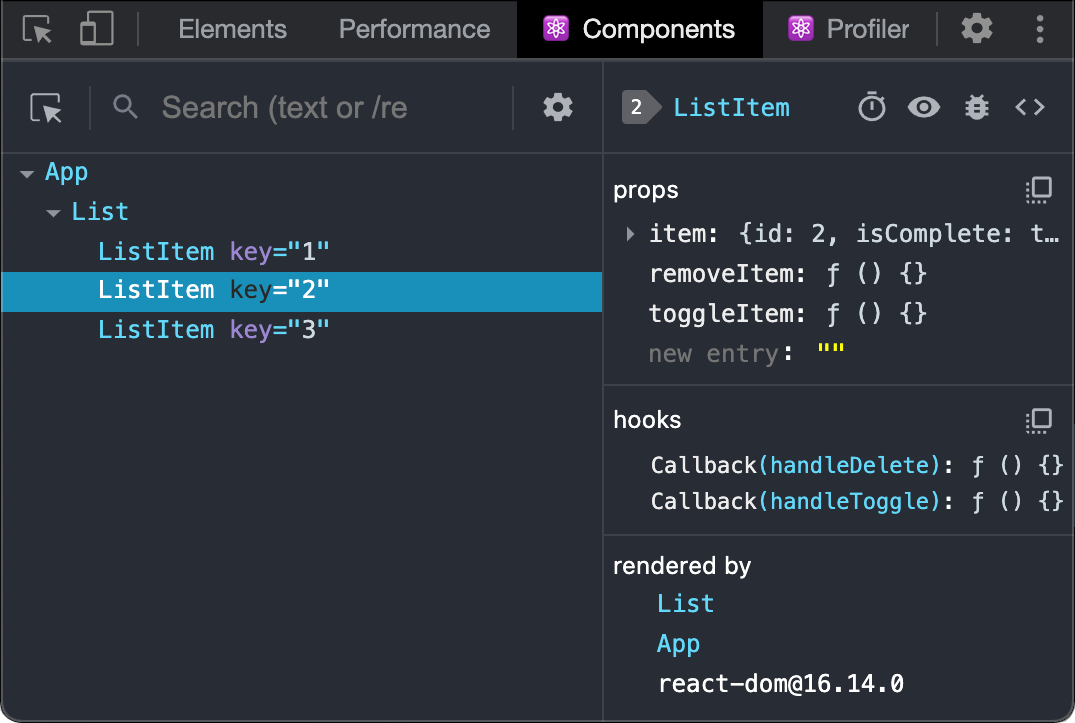
Open the tools from Firefox and land on the tab you are most likely to use first. For most front-end jobs, that is the Inspector. For script issues, the Console or Debugger. The point is not to memorise every panel on day one. Pick one. Learn where it lives. Build out from there.
Mozilla describes Firefox Developer Tools as a built-in set of tools for web developers. That matters because the workflow starts inside the same browser that renders the document, rather than jumping to a separate application. Once the tools are open, dock them where they feel natural. Bottom dock works well on a laptop. Side dock gives more vertical room for CSS and DOM adjustments.
Do a quick scan before touching anything. Confirm the selected panel shows the page you are actually testing, not a stale tab or a cached local build. Small mistake, common problem.
2. Inspect the page structure before changing anything
With the tools open, click into the page structure and select the element you want to understand. Start with something obvious: a headline, navigation item, card or button. The goal is straightforward. Find the exact node the browser is rendering, then see which classes, inherited styles and layout rules are attached to it.
Mozilla’s guide on how to examine and edit CSS is the fastest place to build this habit. Select a node, watch the style rules populate, and read top to bottom. Which rule is active? Which declaration is crossed out? Which value is inherited from a parent container? Those three questions solve a surprising number of layout bugs before a code editor even opens.
More importantly, check whether the issue is structural rather than cosmetic. If a component is missing a class, nested in the wrong wrapper or hidden by a parent container, editing colours and spacing will not fix the real problem. Pause first. Read the DOM.
3. Edit CSS live, then decide whether the fix is real
Once the right element is selected, make a small live edit. Change a margin. Swap a colour. Adjust display rules. Increase a gap. These are disposable tests — that is exactly why they are useful. Firefox applies the change in the browser immediately, so the effect is visible before any source file is saved.
Use the CSS editing workflow to compare before and after states on screen. Before: a card wraps awkwardly, a button sits off-centre, a heading has too little space. After: the page behaves the way the component spec probably intended, and that is the kind of validation a developer needs before committing anything to the repository.
Keep the change set small. One variable at a time beats a burst of random tweaks. If two adjustments solve the issue, undo one and retest. That tells you which declaration actually mattered. It also leaves a cleaner trail when the working correction moves back into the real stylesheet.
4. Use the Web Console to separate noise from a real error
When a page looks wrong, the bug is not always visual. Sometimes the layout breaks because a script failed earlier in the render path. Open the Web Console and refresh the page with the panel visible. Mozilla says the console logs information associated with a web page. That makes it the quickest place to check whether the browser is flagging errors, warnings or network chatter that matches the failure on screen.
Start by ignoring the flood. Extensions, third-party widgets and browser warnings generate noise. Look instead for messages tied to the broken page state: an undefined variable, a failed fetch, a blocked resource, a function that throws when a button is clicked. Reproduce the bug once, then watch which new lines appear. Fresh errors are usually more useful than old background clutter.
For quick checks, the console is handy. Test whether a selector returns the expected element. Confirm that a value exists on window. Inspect the output of a small snippet. Fast answers. Less guesswork.
5. Step through JavaScript when the console is not enough
Sometimes the console points to a script problem but not the cause. Move into the JavaScript Debugger. Mozilla’s documentation describes it as the tool that lets developers step through code and examine or modify state, and that is the point where a vague error message becomes a sequence you can follow.
Set a breakpoint close to the failure path, then trigger the interaction again. Click the button. Submit the form. Load the route. When execution pauses, inspect the current values rather than guessing. Is the variable undefined? Did the function receive the wrong argument? Did the code branch into a path that should never run in production? That is where the bug usually stops looking mysterious.
For breakpoints, keep the strategy tight. One at the event handler, one inside the failing helper, one before a network response is processed. Too many breakpoints slow the flow and make an ordinary front-end bug feel worse than it is. Controlled steps are better.
6. Test the layout in responsive mode before calling the job done
A fix that works at desktop width is only half a fix. Open Responsive Design Mode and retest the changed page at smaller sizes. Mozilla notes the initial viewport is 320 x 480 pixels — a useful low-end check for cramped interfaces, stacked buttons and overflowing tables.
Plenty of developers skip this because the page looks fine on a large monitor. Do not skip it. A margin fix that cleans up desktop spacing can break a mobile card grid. A form label that fits on one line at full width can wrap badly on a narrower viewport. Firefox makes that easy to catch before a pull request lands.
Run through the interaction one more time in responsive mode. Open the menu. Tap the button. Scroll the component. Resize once or twice. If the layout still holds, the fix is much more likely to survive review.
Troubleshooting common Firefox DevTools snags
When the wrong element keeps being selected, zoom the page back to a normal level and try again with a simpler target — a heading or container usually works. Dense interfaces make selection harder when the page is scaled oddly.
When live CSS edits seem to do nothing, check whether the declaration is being overridden higher up the cascade. Crossed-out rules are the clue. So is a property applied to the wrong node.
For a crowded console: clear it, reproduce the problem once, watch only the new output. That usually reveals the signal.
If the debugger pauses too often, disable extra breakpoints and keep only the ones nearest the failing interaction. Less is better here.
What to do next
After these six steps, the next upgrade is repetition rather than complexity. Use Firefox Developer Tools on a real ticket, not a toy demo. Inspect one component, make one live CSS change, trace one console error, follow one function through the debugger. That sequence is enough to turn the tooling from a spare browser feature into a routine part of front-end work.
For teams that already standardise on Chrome, Firefox still earns a place as a second view of the same problem. Different defaults, different presentation, same underlying web platform. And for developers who want a built-in toolkit without installing anything extra, Mozilla’s docs are clear enough to get productive quickly.
Soren Chau
Enterprise editor covering AWS, Azure, and GCP in the AU region, plus the SaaS shaping local IT. Reports from Sydney.