How to use React Developer Tools in 2026
How to use React Developer Tools in 2026: install the extension, inspect components, edit props and state, and profile slow React apps fast.
React Developer Tools usually cuts through the first round of guesswork in a React app. Install it, check that it has latched onto the right tab, inspect the component tree, test props and state, then open the Profiler when the interface drags. For most developers, the core routine takes about 15 minutes.
The official React Developer Tools documentation describes the browser extension as the easiest way to debug websites built with React. That still looks right in 2026. The Chrome Web Store listing shows more than 5,000,000 users, so this is standard kit for front-end teams rather than a side project with patchy maintenance.
“The easiest way to debug websites built with React is to install the React Developer Tools browser extension.”
— React docs
In practice, most developers reach for it for three jobs: seeing how components nest, checking or changing props and state without editing source files, and recording a profile when performance slips. If your workflow includes Safari or React Native, the React DevTools README covers the standalone app, which listens on port 8097 by default.
That split matters. The same tool can help with a stubborn button, a missing prop, or a slow filter panel, but the path through it changes with the problem in front of you.
1. Install the right version for your setup
Start with the browser extension if the app runs in Chrome or another Chromium browser. The React Developer Tools extension remains the fastest install path. The listing currently shows version 7.0.1 and a 4.0 rating, which is a useful sign that the extension is active and still maintained.

Reload the page after installation. When the extension attaches, the browser’s developer tools should show React-specific panels, not just generic DOM views. Elements and Console still matter, but they do not tell you which component or hook triggered a change.
If you work across browsers, do the environment check once for each setup instead of assuming the Chrome path covers everything. For Safari or React Native, skip the store flow and use the standalone tool documented in the React DevTools README. Same debugging surface, different entry point.
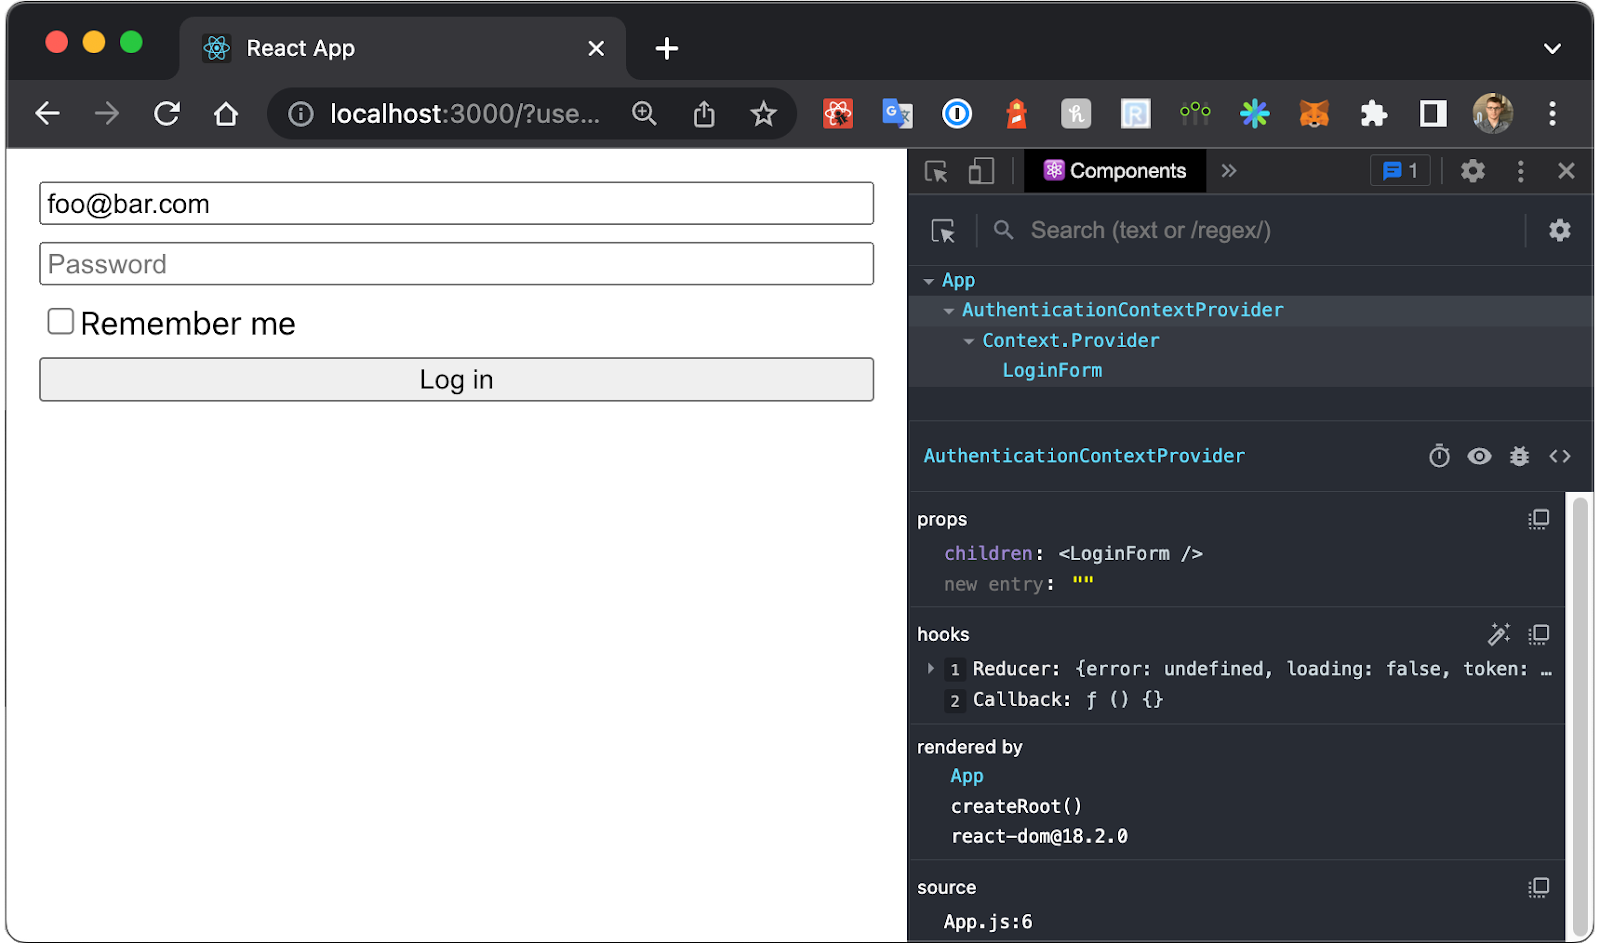
2. Open your app and check that React has been detected
Open the target app first, then open developer tools. Keep the first test simple. If React Developer Tools can see the page, you should get React-aware panels and a live component tree.

If nothing appears, start with the small resets: reload the page, close and reopen developer tools, and confirm you are inspecting the same tab that runs the app. That clears a surprising number of false alarms. Plenty of “it isn’t working” reports turn out to be the wrong tab or a stale window.
Detect first, inspect second. Until the extension attaches, there is nothing useful to inspect inside the React panels.
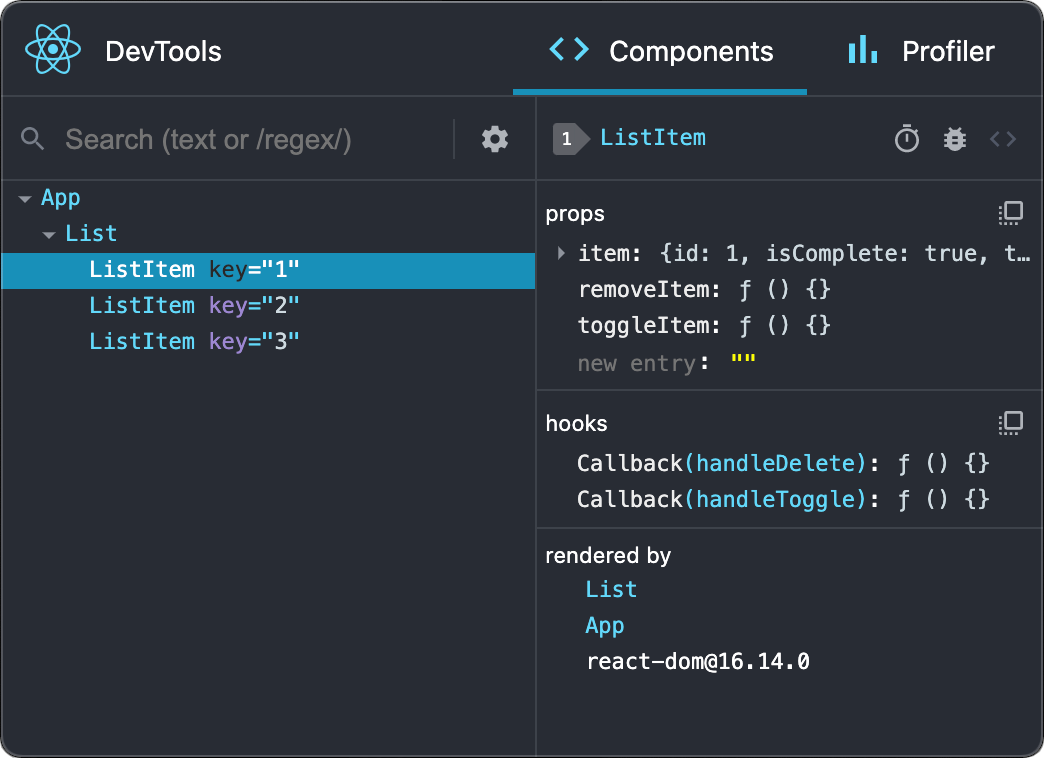
3. Use the Components view to inspect the tree
The Components view does most of the heavy lifting. Use it to move through the rendered tree one component at a time instead of reading generated HTML and guessing. It is usually the quickest way to work out which parent passed a prop, where a list item came from, or which wrapper controls a conditional render.
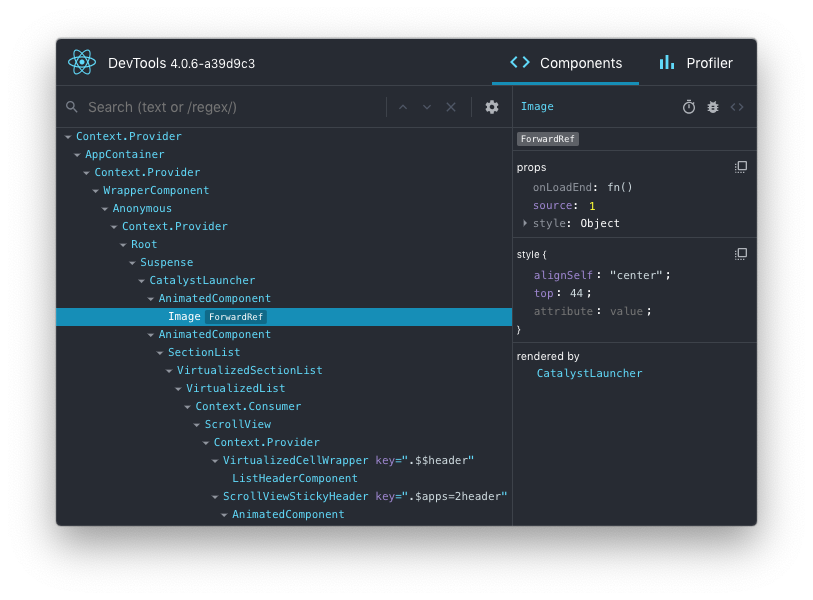
Start with the component closest to the bug, then move outward. Wrong button label? Inspect the button first, then the parent that supplied the prop. Modal will not close? Check the stateful container before the overlay markup. That habit keeps the session anchored to the React tree instead of the DOM.
Before the extension attaches, a developer may see only nested <div> elements. After it does, the same screen becomes a named component map. That is the practical gain.
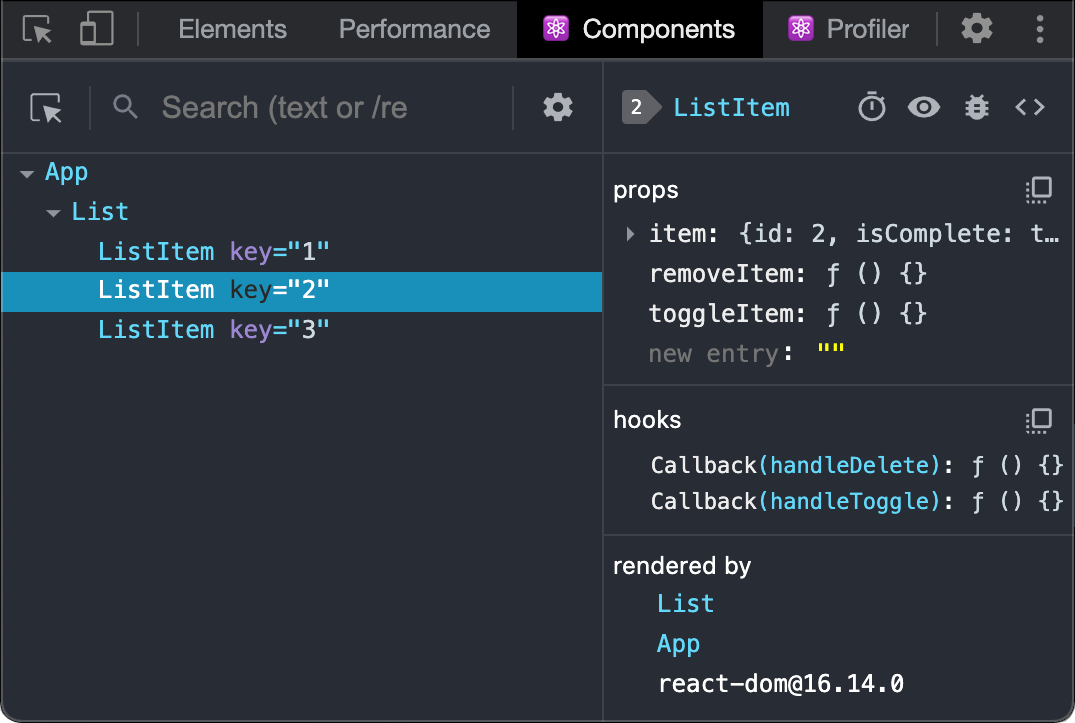
4. Edit props and state to test a theory quickly
With the right component selected, inspect the current props and state. This is where React Developer Tools stops being a viewer and becomes a quick hypothesis check. Change one value, watch the interface respond, and decide whether you are even looking in the right place.
Say a badge is stuck in a loading state. If the component shows loading: true, flip it and see whether the rest of the UI behaves as expected. If a child is rendering the wrong label, compare the live prop value with the value the parent was meant to pass. You are not patching production logic here. You are narrowing the bug: data flow, state transition, or render condition.
Keep the edits small. One value at a time. Bigger manual changes blur the result and make the session harder to read.
5. Record a profile when the app feels slow
Some issues are not visual at all. They show up as typing lag in a form, a filter panel that stutters, or a list that rerenders more often than expected. That is when the Profiler matters more than the Components tree.
Start a recording, perform the slow interaction, then stop. The real gain is sequence. Instead of arguing about whether the app feels slow, the team gets a bounded record of what just happened and which part of the React tree lit up around it. That gives the debugging session a cleaner before-and-after shape.
The React docs frame the tool as part of a practical debugging workflow, not a benchmark suite. Use it that way: profile a real interaction, inspect the components involved, change one thing, then profile again. Short loop. Clearer signal.
6. Use standalone mode for Safari or React Native, then close with troubleshooting
The browser extension covers most web apps, but not every setup. The React DevTools README notes that the standalone app is available for Safari and React Native, with the tool listening on port 8097 by default. That matters for teams moving between browser debugging and device or simulator work.

If nothing shows up, run the troubleshooting list in order: confirm the app is actually using React, reload the page, reopen developer tools, and check that the extension or standalone app matches the environment you are debugging. If the panels appear but the session still feels messy, go back to Components and trace one bug from the leaf component to the parent. That reset usually gets the session moving again.
“Adds React debugging tools to the Chrome Developer Tools.”
— Chrome Web Store listing
Keep React Developer Tools installed, use Components as the default starting point, and save the Profiler for times when performance is the real problem. That is enough to make it part of the daily workflow instead of a last-resort tab.
Soren Chau
Enterprise editor covering AWS, Azure, and GCP in the AU region, plus the SaaS shaping local IT. Reports from Sydney.